Introduction
A chart is a graphical representation of the data. Displaying data as a chart makes it easy for users to see comparisons, patterns, and trends in the data. For example, instead of having to analyze several columns of data in a table, users always like to see at a glance which category of products sales what percentage in the last year.Google chart tools are powerful, simple to use and very useful for creating very interactive charts for browsers and mobile devices.
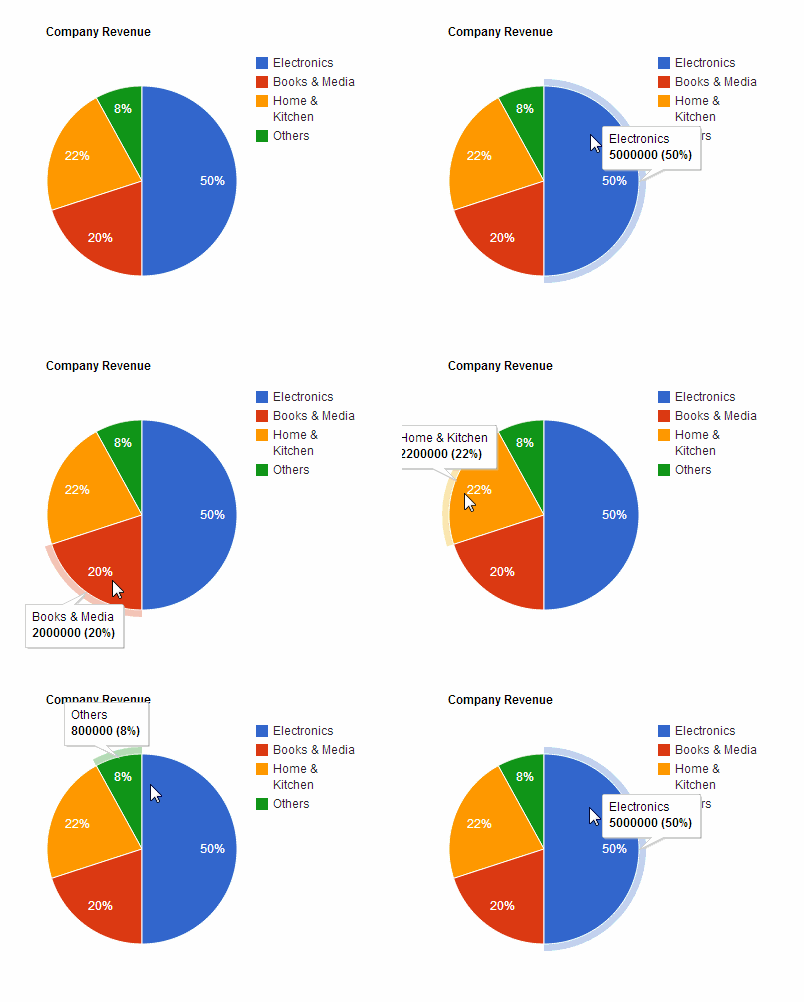
So In this tutorial, I am going to explain, how to create Google Pie chart with database data in ASP.NET. Here I have fetched SQL server database data using jquery to create google pie chart in asp.net.
Google Chart Post :
Steps :
Step - 1 : Create New Project.
Go to File > New > Project > Select asp.net web forms application > Entry Application Name > Click OK.Step-2: Add a Database.
Go to Solution Explorer > Right Click on App_Data folder > Add > New item > Select SQL Server Database Under Data > Enter Database name > Add.Step-3: Create table for getting data for chart.
Open Database > Right Click on Table > Add New Table > Add Columns > Save > Enter table name > Ok.Step-4: Add Entity Data Model.
Go to Solution Explorer > Right Click on Project name form Solution Explorer > Add > New item > Select ADO.net Entity Data Model under data > Enter model name > Add.A popup window will come (Entity Data Model Wizard) > Select Generate from database > Next >
Chose your data connection > select your database > next > Select tables > enter Model Namespace > Finish.
Step-5: Add a web page and design for show google chart (pie) with database data.
HTML Code <div id="chart_div" style="width:500px;height:400px">
<%-- Here Chart Will Load --%>
</div>
Step-6: Add Jquery code for call server side function for get data from sql server database.
Write this below jquery code inside page <head></head> section.Jquery Code
           <%-- Here We need to write some js code for load google chart with database data --%>
            <script src="Scripts/jquery-1.7.1.js"></script>
            <script type="text/javascript" src="https://www.google.com/jsapi"></script>

            <script>
                var chartData; // globar variable for hold chart data
                google.load("visualization", "1", { packages: ["corechart"] });

                // Here We will fill chartData

                $(document).ready(function () {

                    $.ajax({
                        url: "GoogleChart.aspx/GetChartData",
                        data: "",
                        dataType: "json",
                        type: "POST",
                        contentType: "application/json; chartset=utf-8",
                        success: function (data) {
                            chartData = data.d;
                        },
                        error: function () {
                            alert("Error loading data! Please try again.");
                        }
                    }).done(function () {
                        // after complete loading data
                        google.setOnLoadCallback(drawChart);
                        drawChart();
                    });
                });


                function drawChart() {
                    var data = google.visualization.arrayToDataTable(chartData);

                    var options = {
                        title: "Company Revenue",
                        pointSize: 5
                    };

                    var pieChart = new google.visualization.PieChart(document.getElementById('chart_div'));
                    pieChart.draw(data, options);

                }

            </script>
Step-7: Write server-side code (function) for getting data from SQL server database.
Before writing code add this namespace to your code behind page. using System.Web.Script.Services;
using System.Web.Services;
Here is the function, which is called by jquery code. [WebMethod]
[ScriptMethod(ResponseFormat = ResponseFormat.Json)]
public static object[] GetChartData()
{
List<GoogleChartData> data = new List<GoogleChartData>();
//Here MyDatabaseEntities is our dbContext
using (MyDatabaseEntities dc = new MyDatabaseEntities())
{
data = dc.GoogleChartDatas.ToList();
}
var chartData = new object[data.Count + 1];
chartData[0] = new object[]{
"Product Category",
"Revenue Amount"
};
int j = 0;
foreach (var i in data)
{
j++;
chartData[j] = new object[] {i.ProductCategory, i.RevenueAmount };
}
return chartData;
}
Step-8: Run Application
Download Application Live Demo


